

Reports & insights
Numbers you can take to the finance team.
Revenue, occupancy, bookings, permits and validations, all from the same records. The dashboard, the reports and your exports always agree.

Ten ready-made reports
Filter by dates, car park, company and payment type, and see it charted.
Export anything
Download every row and column for your accounts or your own spreadsheets.
A history nobody can edit
Who changed what and when, kept for good. Payments can't be quietly altered.
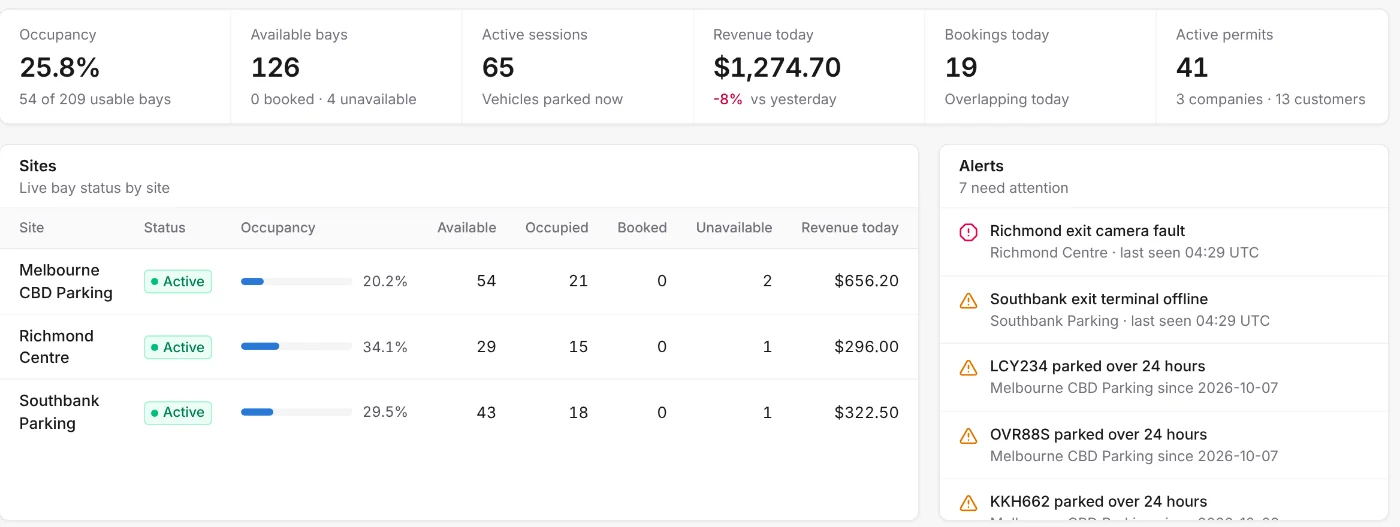
Today, at a glance.
The dashboard shows what's happening across every site right now, and flags anything that needs you.
- Occupancy, free bays and cars parked now
- Today's revenue against yesterday
- Alerts for faulty cameras and long stays
The reports, ready when you are.
See ParkCanvas run a car park like yours.
A 30-minute walkthrough shaped around your sites, your tariffs and the way your drivers pay today.